Every team has a dashboard or two. But very few have the numbers that actually drive decisions.
The difference is almost always the quality of the metrics being tracked. A dashboard showing assessment completion rates tells leadership how busy the team is. A dashboard showing critical findings closed per cycle, average days to closure by severity, and score trajectory across the portfolio tells leadership how much risk the program is actually reducing.
54% of data breaches in 2024 were linked to third-party vendors, spurring demand for automated risk platforms. The metrics you track determine whether your program detects and closes that exposure before it becomes an incident or finds out about it afterward.
KPIs vs. KRIs : Understanding the Difference
Before you start tracking metrics, it helps to know which kind you’re working with. Mixing them up is one of the main reasons teams end up reporting activity instead of risk.
| |
KPI
|
KRI
|
|
What it measures
|
How well your program performs
|
How much risk your organization currently faces
|
|
Direction
|
Lagging (reflects past performance)
|
Leading (signals emerging risk before it materializes)
|
|
Primary use
|
Program improvement, board reporting
|
Decision triggers, escalation actions
|
|
Example
|
Assessment cycle time
|
Percentage of Tier 1 vendors below minimum risk score
|
Here’s the rule: if a metric changes only after a problem has occurred, it is a KPI. If it warns you that a problem is developing before it materializes, it is a KRI. Your program needs both. Neither replaces the other.
15 KPIs to Track for Your TPRM Program
These are the performance indicators that distinguish programs with measurable outcomes from those that measure only their own activity.
1. Vendor inventory completeness rate: Percentage of active vendor relationships with a documented risk profile and tier classification.
Target: 100% for Tier 1 vendors, 90% across the full portfolio.
Studies show that up to 75% of vendors either do not answer security questionnaires or fail to do so in a timely manner. Below 80% overall means risk prioritization is based on an incomplete picture.
2. Assessment cycle time: Average days from assessment initiation to completion.
Industry average: 30 to 45 days.
Best-in-class: under 10 days.
However, the EY Global TPRM Survey showed that almost 40% organisations take 61 days or more. Cycles consistently above 45 days indicate process or tooling problems.
3. Assessment completion rate by tier: Percentage of vendors in each risk tier with a completed assessment within the required cycle.
Critical-tier: 100%.
Lower tiers: set thresholds in your risk policy and enforce them consistently.
4. Vendor onboarding time: Average days from vendor approval to completion of onboarding with a documented risk profile.
Industry average: 45 to 60 days.
Best-in-class: under 10 days.
Slow onboarding creates pressure on business units to bypass the TPRM process.
5. Finding closure rate by severity: Percentage of remediation findings formally closed with validated evidence within the SLA window, by severity tier. A closure rate below 80% for critical findings signals a governance problem, not a vendor problem.
6. Average days to finding closure: How long do findings take to move from identification to verified closure by tier?
Targets: critical within 30 days, high within 60 days, medium within 90 days.
Significant variance points to missing ownership or weak escalation.
7. SLA adherence rate: Percentage of remediation deadlines met across the active finding queue.
Target: above 90%.
This is the single most useful metric for demonstrating governance quality to regulators and auditors.
8. Vendor coverage rate: Percentage of the total vendor portfolio with an active, current risk assessment on file. 94% of organizations say they would assess more vendors if they had more time and resources.
Industry average for manual programs: 25-30%.
Best-in-class: 90 to 95%.
9. Cost per assessment: Total TPRM program cost divided by completed assessments per cycle. Demonstrates operational efficiency and supports budget conversations. Automation typically reduces this by 40-60%.
10. Questionnaire response rate: Percentage of questionnaires sent to vendors that receive a complete response within the requested window. Rates below 70% suggest your questionnaire process needs vendor-facing improvements, not more follow-up emails.
11. Re-assessment rate after material risk events: When a vendor breach, credit downgrade, or certification lapse occurs, what percentage of affected vendors receive an out-of-cycle reassessment within 30 days? Below 80% means monitoring signals are not translating into program action.
12. Regulatory finding rate: Number of TPRM-related findings raised in regulatory examinations per audit cycle. The target is zero. Persistent findings in the same control area signal a systemic gap that tactical annual responses are not addressing.
13. Audit preparation time: Days required to assemble evidence packages for a regulatory or internal audit. Best-in-class programs produce continuous close-out reports and deliver audit packages in under 30 days.
14. Third-party incident rate: Number of security or operational incidents attributable to vendor-introduced risk per year. Trend this over time. A declining rate in a growing vendor portfolio is the clearest signal your program is producing actual risk reduction.
15. Board reporting completeness: Does your quarterly board report include: live risk exposure by vendor tier, assessment cycle status, remediation SLA performance, and score trajectory? Programs delivering all four without manual assembly demonstrate operational maturity.
5 Key Risk Indicators (KRIs) to Watch With Thresholds
KRIs warn you before a risk event occurs. Each one below includes a threshold that should trigger a defined action, not a discussion of whether action is needed.
KRI 1: Percentage of Tier 1 vendors below the minimum acceptable risk score
Signal: Critical vendors whose controls fall below your risk appetite.
Threshold: More than 10% of Tier 1 vendors with a score below the minimum trigger escalation and an emergency reassessment within 15 days.
KRI 2: Number of vendors with lapsed security certifications
Signal: Deteriorating control environment in vendors that previously met your standards. Threshold: Any Tier 1 vendor with a lapsed SOC 2, ISO 27001, or HIPAA audit report triggers a remediation plan request within 10 business days.
KRI 3: Vendor score decline rate over 90 days
Signal: Emerging deterioration in security posture, financial stability, or compliance status before it becomes an incident.
Threshold: Any Tier 1 or Tier 2 vendor whose score has declined more than 15 points over 90 days triggers a scheduled out-of-cycle reassessment.
KRI 4: Undisclosed fourth-party sub-processor exposure
Signal: Vendor supply chain opacity is creating unmonitored risk.
Threshold: More than 20% of Tier 1 vendors are unable to produce a current sub-processor list on request, triggering a contract review and an enhanced monitoring flag.
KRI 5: Overdue remediation findings for Tier 1 vendors
Signal: Critical vendors are not closing findings within SLA windows, resulting in open residual risk that accumulates between assessments.
Threshold: Any Tier 1 vendor with more than two overdue critical or high findings triggers escalation to executive leadership and a vendor engagement review.
How to Choose the Right TPRM Metrics for Your Organization
Not every metric fits every organization. The right ones depend on your regulatory requirements and where your program tends to break down.
Start by looking at your regulatory framework.
If you operate under DORA (Digital Operational Resilience Act), you must demonstrate documented remediation progress and ICT risk register accuracy, which maps directly to finding closure rate, SLA adherence, and audit preparation time.
HIPAA-covered healthcare organizations should prioritize the completion and reassessment rates for business associate assessments following vendor incidents.
RBI guidelines (for regulated entities in India) require documented risk classification and board-level reporting on vendor concentration risk.
MAS TRM guidelines (Monetary Authority of Singapore) require risk-based assessment frequency and evidence of continuous monitoring.
Identify where your program breaks. If vendors consistently fail to respond to questionnaires on time, questionnaire response rate and assessment cycle time are your highest-leverage metrics. If leadership cannot describe vendor risk exposure without a manual status update, board reporting completeness is the metric that drives the dashboard investment conversation.
The rule is simple: Track the numbers that drive decisions, not just the ones that show you’re busy. Five metrics that trigger action matter more than twenty that fill a slide deck.
Making TPRM Metrics Operational: The ComplyScore® Approach
These 15 KPIs and 5 KRIs represent the control structure. But they only work if the data infrastructure can deliver them in real time.
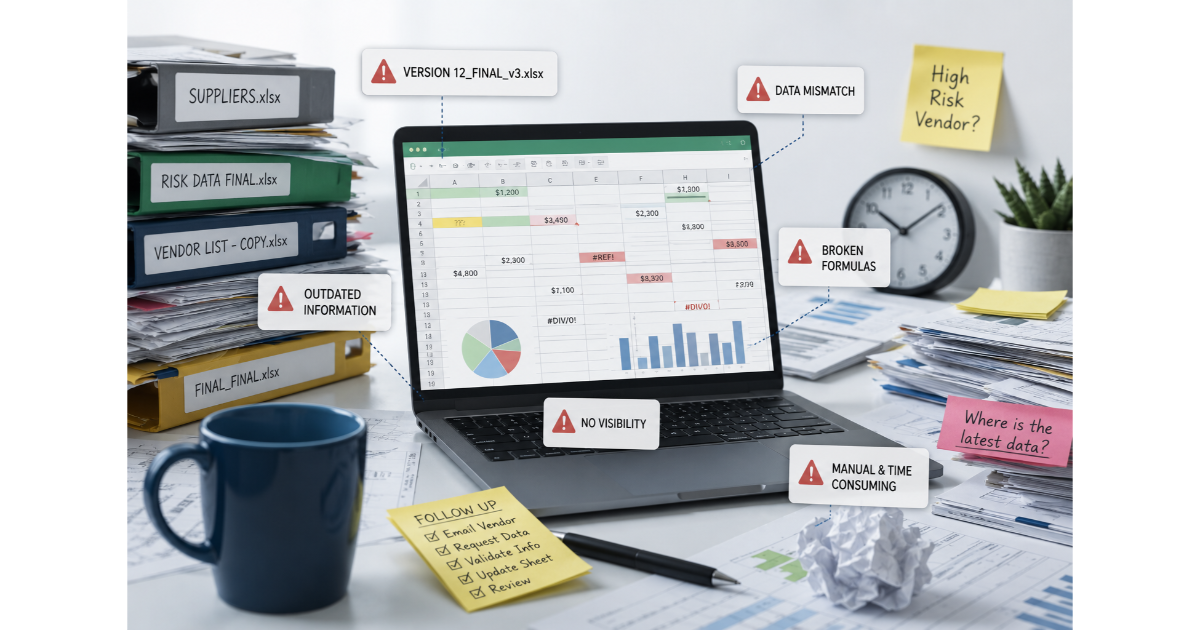
In manual or spreadsheet-based programs, you'll calculate most of these metrics after the fact. By the time the numbers are final, the risk landscape has changed. You're reporting history, not informing current decisions.
ComplyScore® makes these metrics live, not historical.
Automated remediation workflows enforce SLA compliance and produce the audit trail that turns KPI data into regulatory evidence that holds up under examination.
Organizations running on ComplyScore® consistently achieve:
- Assessment cycles: under 10 days
- Vendor coverage: 90–95%
- SLA adherence: above 90%
- Audit readiness: under 30 days
These aren't aspirational targets. These are the operating metrics of programs running on real-time data infrastructure.
See how ComplyScore® makes TPRM metrics operational for your program. Request a demo.
FAQs
What are third-party risk management metrics?
TPRM metrics are quantitative measures used to evaluate program performance and risk exposure. They split into KPIs (which measure how well the program functions, such as assessment cycle time and finding closure rate) and KRIs (which measure the organization's current risk, such as the percentage of critical vendors below acceptable thresholds).
How often should TPRM metrics be reviewed and updated?
Operational KPIs should be reviewed monthly by the TPRM team and reported to leadership quarterly. KRIs require more frequent monitoring because they function as leading risk indicators. Critical-tier vendor score changes and lapsed certifications should trigger immediate review regardless of the reporting calendar. The full metric set should be evaluated annually against regulatory requirements and changes in program maturity.
What TPRM metrics do regulators like RBI, MAS, or DORA require?
DORA requires documented remediation status and an accurate ICT risk register, which maps to closure rate, SLA adherence, and audit preparation time. RBI guidelines require documented risk classification and board-level reporting on vendor concentration risk. MAS TRM guidelines require risk-based assessment frequency and monitoring of evidence. In all cases, the metric must be producible on demand, not reconstructed before each examination.
What is a good vendor risk score benchmark?
A practical threshold for critical-tier vendors is that no vendor should score below 70 out of 100 (or the equivalent on your scoring model) without a documented compensating control and an active remediation plan. For the overall portfolio, maintain a portfolio-average residual risk score at or above your defined risk appetite threshold, with no more than 10% of Tier 1 vendors below that threshold at any given time.
What metrics are most useful for measuring third-party risk?
The five metrics that drive the most meaningful decisions: vendor coverage rate, finding closure rate by severity, SLA adherence, third-party incident rate over time, and vendor score trajectory. Everything else supports these five or adds reporting detail that does not change a decision.
What metrics should be collected to show progress with third-party risk management reviews?
Progress metrics should answer three questions for leadership: Are we covering more of the vendor portfolio than last quarter? Are we closing findings faster? Are our critical vendors carrying lower residual risk scores? Assessment completion rate, average days to closure, and portfolio-average risk score trends over rolling 90-day windows answer those questions without requiring a complex dashboard to interpret.
What key risk indicators (KRIs) shape your organization's TPRM program?
The five KRIs that most directly predict emerging third-party risk: percentage of Tier 1 vendors below your minimum acceptable risk score, number of vendors with lapsed security certifications, vendor score decline rate over 90 days, undisclosed fourth-party sub-processor exposure, and overdue remediation findings for Tier 1 vendors. Each change occurs before a risk event occurs, giving your team time to act rather than respond.


.png?width=387&height=387&name=image%20(5).png)


.webp)


.webp)

.png)